
The statement of cash flows (SCF) is one of the three main financial statements that show the financial performance and position of a company. The SCF summarizes the cash inflows and outflows that occurred during a specific period, such as a month, a quarter, or a year. The SCF reveals how a company manages its cash, which is vital for its operations, investments, and financing activities.
The SCF complements the income statement and the balance sheet, which are based on the accrual accounting principle. The accrual accounting principle records revenues and expenses when they are earned or incurred, regardless of when cash is actually received or paid. Therefore, the income statement and the balance sheet do not reflect the actual cash movements of the company. The SCF bridges the gap between these two statements by showing the sources and uses of cash.
The Structure of the Statement of Cash Flows
The SCF consists of three sections: cash flow from operating activities, cash flow from investing activities, and cash flow from financing activities. Each section shows the net amount of cash that was generated or used by the company in that category.
Cash Flow from Operating Activities
Cash flow from operating activities (CFO) shows the cash generated or used by the company’s core business activities. These activities include the production and sale of goods and services, as well as the payment and collection of cash related to these activities. CFO reflects the company’s ability to generate cash from its operations, which is essential for its profitability and solvency.

CFO can be calculated using two methods: the direct method or the indirect method. The direct method lists the major cash receipts and payments from operating activities, such as cash received from customers, cash paid to suppliers, cash paid for wages, and cash paid for taxes. The indirect method starts with the net income from the income statement and adjusts it for non-cash items, such as depreciation, amortization, gains or losses on asset sales, and changes in working capital items, such as accounts receivable, inventory, and accounts payable.
Cash Flow from Investing Activities
Cash flow from investing activities (CFI) shows the cash generated or used by the company’s investments in long-term assets, such as property, plant, and equipment, intangible assets, and financial assets. These investments are usually made to expand or improve the company’s productive capacity, which can enhance its future earnings potential.
CFI typically includes the cash outflows for purchasing or constructing long-term assets, and the cash inflows for selling or disposing of long-term assets. CFI also includes the cash outflows for acquiring or merging with other businesses, and the cash inflows for divesting or spinning off parts of the business. CFI may also include the cash inflows or outflows from lending or borrowing money, or buying or selling equity or debt securities, if these activities are considered part of the company’s investment strategy.
Cash Flow from Financing Activities
Cash flow from financing activities (CFF) shows the cash generated or used by the company’s financing activities, such as raising or repaying debt, issuing or repurchasing equity, and paying dividends. These activities affect the company’s capital structure, which is the mix of debt and equity that the company uses to finance its operations and investments.

CFF typically includes the cash inflows from issuing debt or equity, and the cash outflows for repaying debt or repurchasing equity. CFF also includes the cash outflows for paying dividends or interest to the shareholders or creditors. CFF may also include the cash inflows or outflows from leasing assets, if these activities are considered part of the company’s financing strategy.
How to Read and Analyze the Statement of Cash Flows
The statement of cash flows provides valuable information about the company’s liquidity, solvency, and financial flexibility. Liquidity is the ability of the company to meet its short-term obligations with its available cash or cash equivalents. Solvency is the ability of the company to meet its long-term obligations with its cash flows from operations and investments. Financial flexibility is the ability of the company to adapt to changing business conditions and opportunities with its cash flows from financing activities.
To read and analyze the statement of cash flows, one can use the following steps:
- Compare the net cash flow from each section with the net income from the income statement. A positive net cash flow from operating activities indicates that the company is generating enough cash from its core business to cover its operating expenses and invest in its growth. A negative net cash flow from operating activities indicates that the company is relying on external sources of cash, such as borrowing or issuing equity, to fund its operations. A positive net cash flow from investing activities indicates that the company is selling more assets than it is buying, which may imply that the company is downsizing or restructuring its business. A negative net cash flow from investing activities indicates that the company is investing more in its long-term assets, which may imply that the company is expanding or diversifying its business. A positive net cash flow from financing activities indicates that the company is raising more capital than it is paying back, which may imply that the company is growing or leveraging its business. A negative net cash flow from financing activities indicates that the company is paying back more capital than it is raising, which may imply that the company is shrinking or deleveraging its business.
- Calculate the free cash flow (FCF) of the company. FCF is the amount of cash that the company has left after paying for its operating expenses and investing in its long-term assets. FCF can be calculated by subtracting the net cash flow from investing activities from the net cash flow from operating activities. FCF measures the financial health and performance of the company, as well as its ability to pay dividends, repurchase shares, or pursue new opportunities. A positive FCF indicates that the company is generating more cash than it is spending, which means that the company has excess cash to distribute to its shareholders or reinvest in its growth. A negative FCF indicates that the company is spending more cash than it is generating, which means that the company has a cash shortfall that needs to be covered by external sources of cash, such as borrowing or issuing equity.
- Calculate the cash flow ratios of the company. Cash flow ratios are financial ratios that use the cash flow data from the statement of cash flows to evaluate the liquidity, solvency, and financial flexibility of the company. Some of the common cash flow ratios are:
- Operating cash flow ratio: This ratio measures the liquidity of the company by comparing the net cash flow from operating activities with the current liabilities. It shows how many times the company can pay off its current liabilities with its operating cash flow. A higher ratio indicates a higher liquidity and a lower risk of default. The operating cash flow ratio can be calculated by dividing the net cash flow from operating activities by the current liabilities.

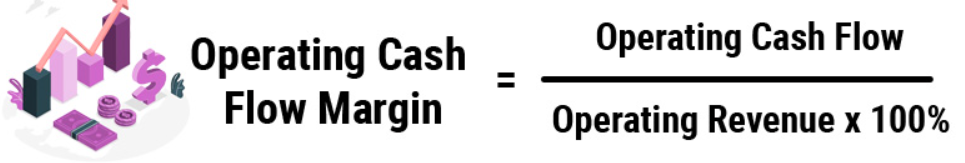
- Operating cash flow margin ratio: This ratio measures the profitability of the company by comparing the net cash flow from operating activities with the net sales. It shows how much cash the company generates from each dollar of sales. A higher ratio indicates a higher profitability and a higher efficiency. The cash flow margin ratio can be calculated by dividing the net cash flow from operating activities by the net sales.
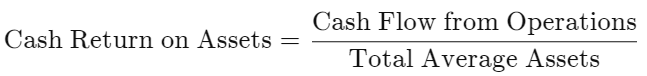
- Cash return on assets ratio: This ratio measures the return on investment of the company by comparing the net cash flow from operating activities with the total assets. It shows how well the company uses its assets to generate cash. A higher ratio indicates a higher return and a higher productivity. The cash return on assets ratio can be calculated by dividing the net cash flow from operating activities by the total assets.
- Debt service coverage ratio: This ratio measures the solvency of the company by comparing the net cash flow from operating activities with the total debt service, which is the sum of the principal and interest payments on the debt. It shows how many times the company can pay off its debt service with its operating cash flow. A higher ratio indicates a higher solvency and a lower risk of default. The debt service coverage ratio can be calculated by dividing the net cash flow from operating activities by the total debt service.


One thought on “What is the Statement of Cash Flows and How to Read It?”